Attractiveness test: what it measures and how to get a fair score
An attractiveness test scores a photo of your face, not you. Ours draws every one of its 65+ measurements on your front and side photos so you can check them, and takes about a minute plus a little care with the camera.
The short version
- Only one of the 4 pillars, Harmony, comes from the lines drawn on your photos. The other three rate how features such as your jaw and skin look, so a measured line and a rating can disagree about the same part of your face.
- Half of our 65+ measurements come from a side photo, so a test that only takes a front photo never sees your jaw angle in profile or your chin position.
- Our three example faces all score Good overall, yet the one with the best Harmony has the lowest Angularity and Masculinity. Read the pillars before the final score.
- Shoot from about 1.5 m with the lens at eye level. In our model, a phone 10 cm below your eyes at 40 cm flattens canthal tilt by almost 3 degrees, more than the whole men's ideal range.
- Re-scans of the same photos moved our overall score by under 0.1, so count only pillar changes of half a point or more. If a score jumps, check the photos first.
The most an attractiveness test can do is estimate how a group of strangers would rate one photo of your face, and show which parts of that face pull the score up or down. It can’t tell you whether one particular person will find you attractive. When over 2,000 adults, most of them twins, each rated 200 faces, about half the variation in their ratings came down to personal taste.2
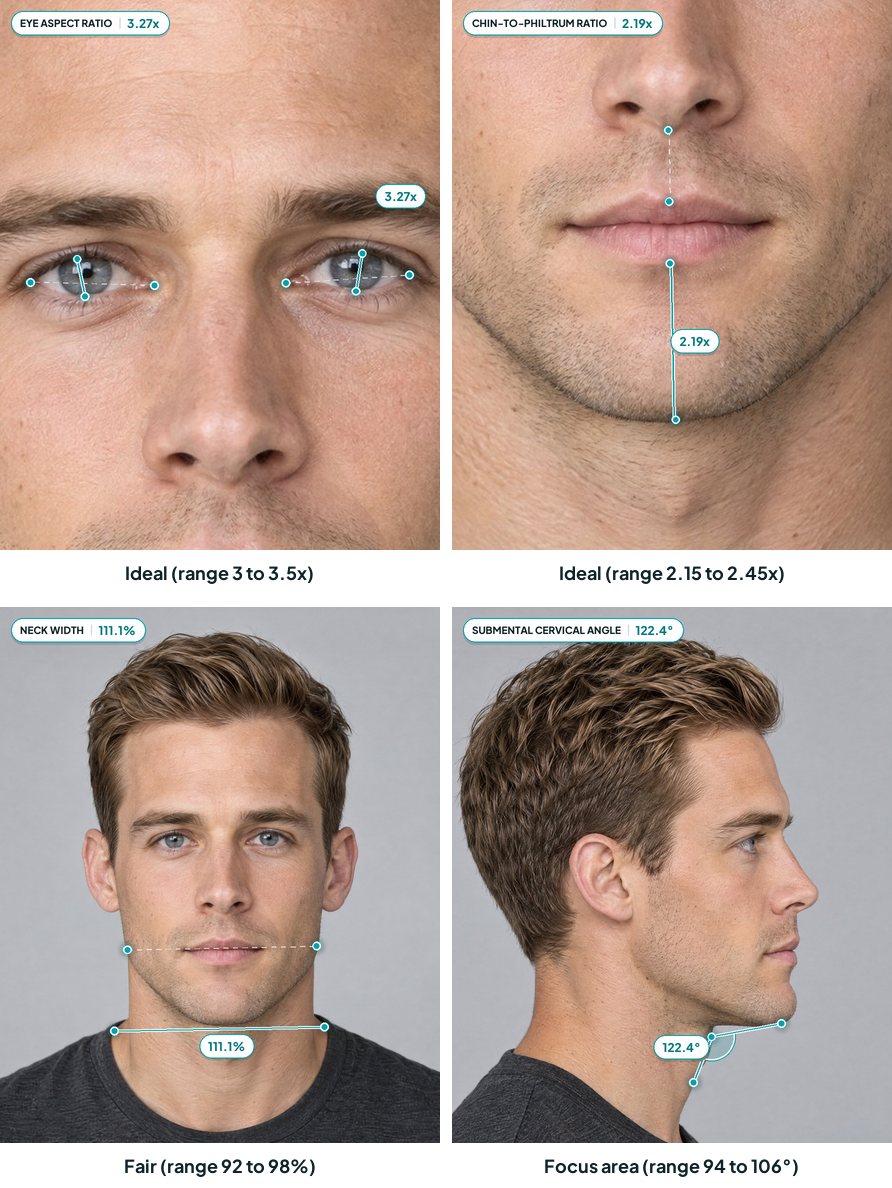
The single number is the least useful part of a result. The man in our sample report scores 7.0, Good, but his Harmony, the pillar built from the 66 measurements drawn on his photos, is only Fair, and two of his six focus areas are his neck width and the angle under his chin. That is the part worth reading, and you only see it if the test draws its lines.
What does an attractiveness test measure?
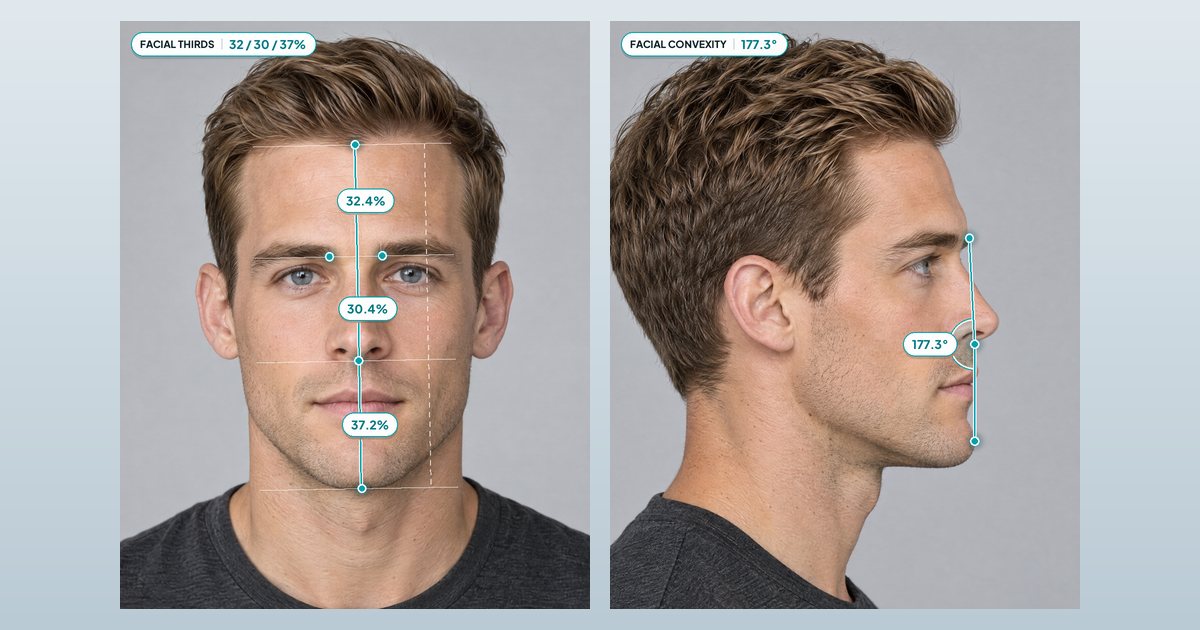
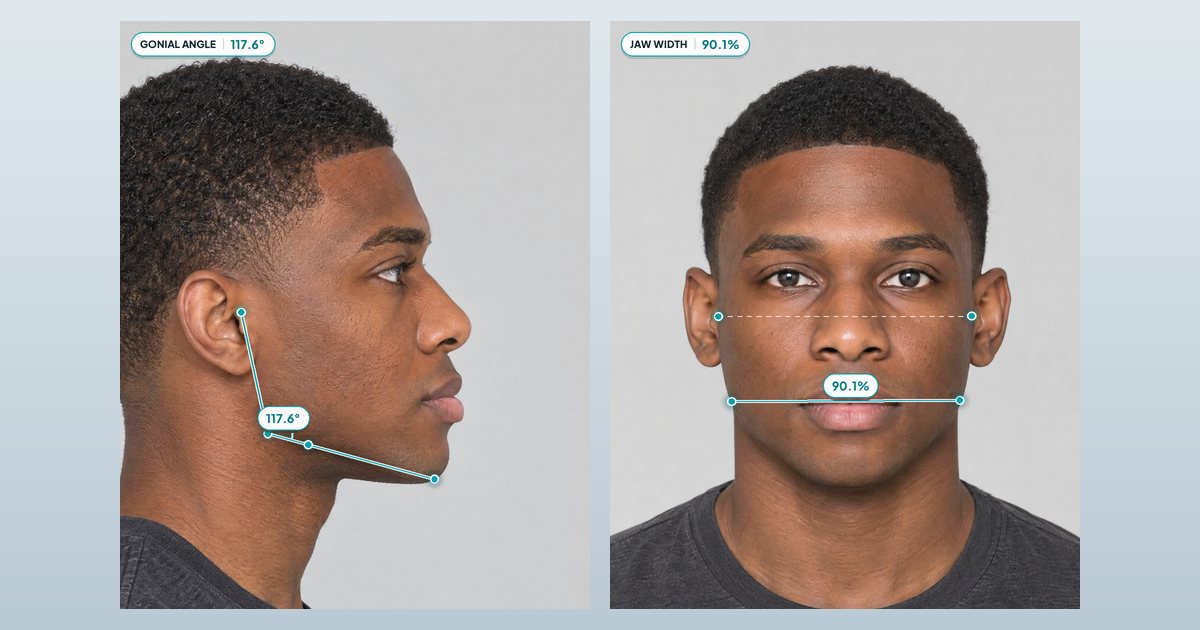
Most attractiveness tests that show a breakdown measure proportions: they place points on your face and score the distances and angles between them against ideal ranges. Others place no points and hand you one number, learned from how crowds rated other faces. Ours does the first, then rates how features look, from jaw definition to skin. You upload a front photo and a side photo at a full 90 degrees, and pick Male or Female and a heritage (or “Prefer not to say”); neither is guessed from the photo. A 478-point face mesh goes on the front photo and profile points on the side (how the points are placed), and about a minute later every line and rating has a score out of 10.
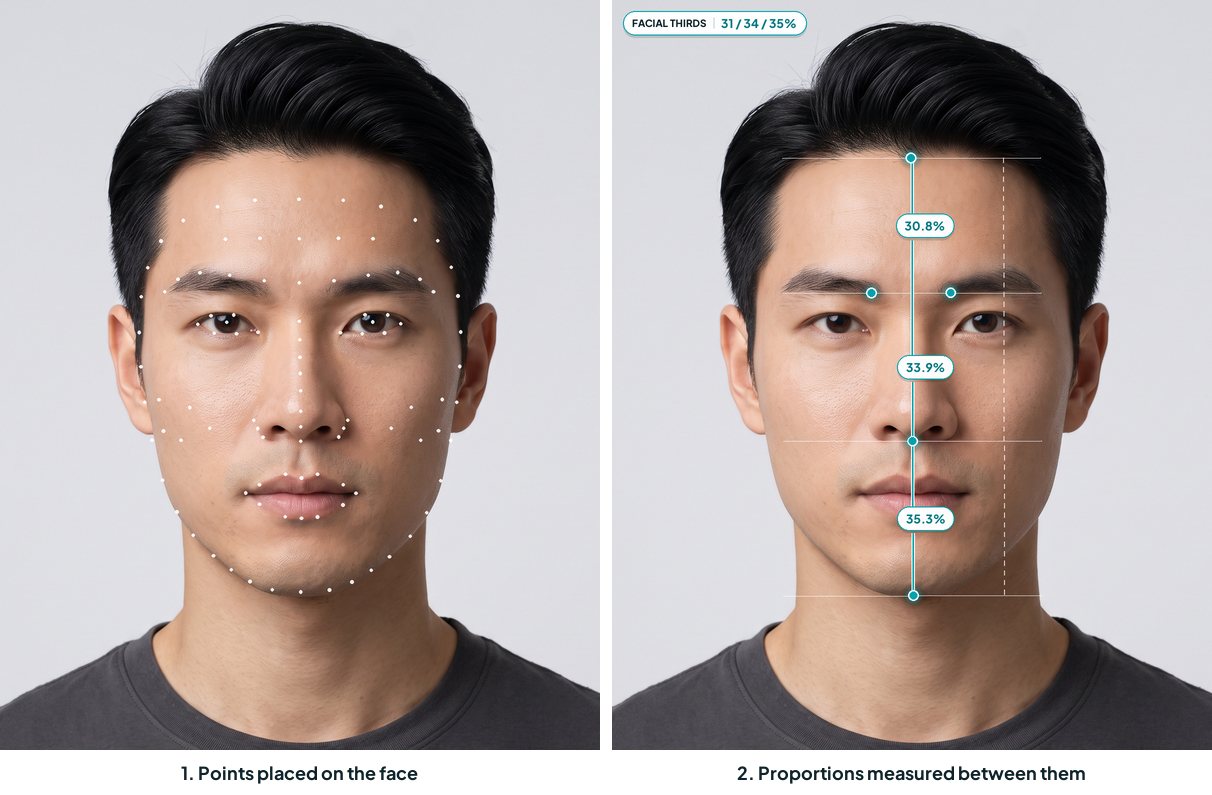
Here is what went into the sample report.
| Input | How many | Examples | Feeds |
|---|---|---|---|
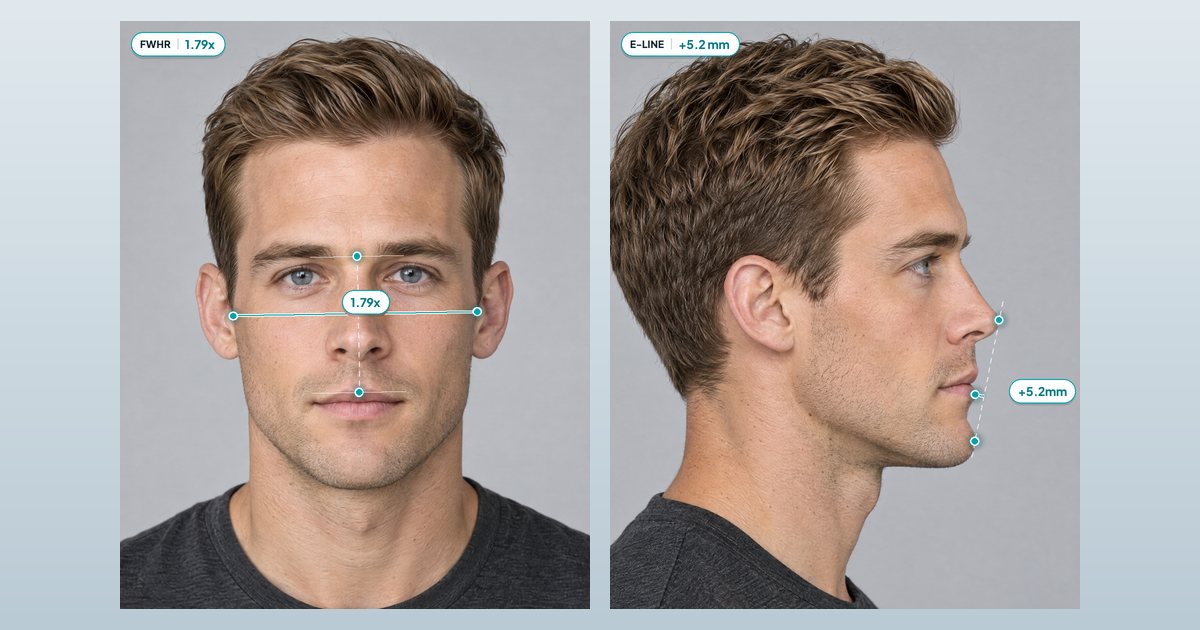
| Front-photo measurements | 33 | facial thirds, eye spacing, canthal tilt, jaw width, face width to height | Harmony |
| Side-photo measurements | 33 | jaw angle, chin position, nose angles, lip lines, under-chin angle | Harmony |
| Visual ratings | 46 (5 + 10 + 31) | jaw and chin definition, brow ridge, skin, under-eye, hair | Angularity, Masculinity or Femininity, Features |
| Symmetry | 10 zones, left against right | how closely the two halves match | Features, lightly |
Most photo tests cover the usual list of symmetry, proportions, eyes, nose, lips, jaw and skin. The bigger difference is the side photo, which half our measurements need. A facial attractiveness test that takes a single front photo can’t see your jaw angle from the side, your chin position, the profile of your nose and lips, or the angle under your chin. If your jaw or chin is your strong point, it can’t give you full credit for it.
The 4 pillars borrow cues that research links to attractiveness: an average-looking shape, a lean face, a sex-typical shape and healthy-looking skin.564 Harmony borrows most loosely. It scores your proportions against ideal ranges, not against the average face, and some ranges, such as canthal tilt, sit above the averages that some studies have measured. The weights inside each pillar are our call. The golden ratio plays no part.
One test result, line by line
Back to the man from our sample report. His 7.0 comes from four pillars built in two ways: one from the lines drawn on his photos, three from ratings of how his features look.
| Pillar | Built from | Score | Pulled up by | Held back by |
|---|---|---|---|---|
| Harmony | 66 measurements | 5.9, Fair | eye aspect ratio (3.27) and chin-to-philtrum (2.19), both Ideal | under-chin angle (122.4°), neck width (111.1%) |
| Angularity | 5 visual ratings | 7.7, Good | jaw, chin and under-chin definition, 8 each | cheek leanness 7, cheekbone prominence 7 |
| Masculinity | 10 visual ratings | 7.2, Good | jaw 8, face shape 8 | lips 6 |
| Features | 31 visual ratings plus symmetry | 7.5, Good | skin, 9.5 on average | creasing (nasolabial folds 7) |
| Final score | the 4 pillars | 7.0, Good | three Good pillars | Harmony, the weakest |
Harmony, the measured lines
His 66 measurements break down as 20 Ideal, 19 Great, 11 Good, 14 Fair and 2 Focus area, and their scores average 8.0. His Harmony is still only Fair, because this pillar turns small misses into bigger point losses. A face scoring 8 on all 66 would get about 6.3. Our facial harmony guide shows the math.
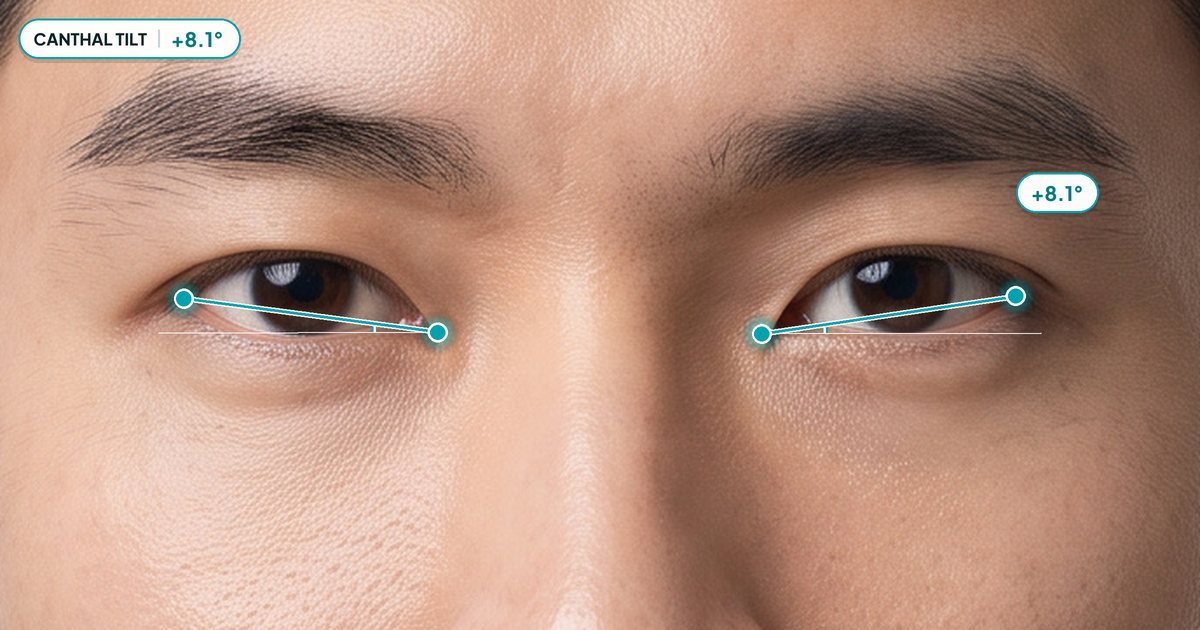
Besides his neck width and under-chin angle, his focus areas include his canthal tilt, +2.7 degrees. That is a positive tilt and a common one, but it sits below his ideal range of 6 to 7.7. It is also one of the lines a phone held below eye level pushes lower, so if your own tilt reads low, check step 3 of the photo checklist before you believe it.
Angularity and Masculinity, rated from the photos
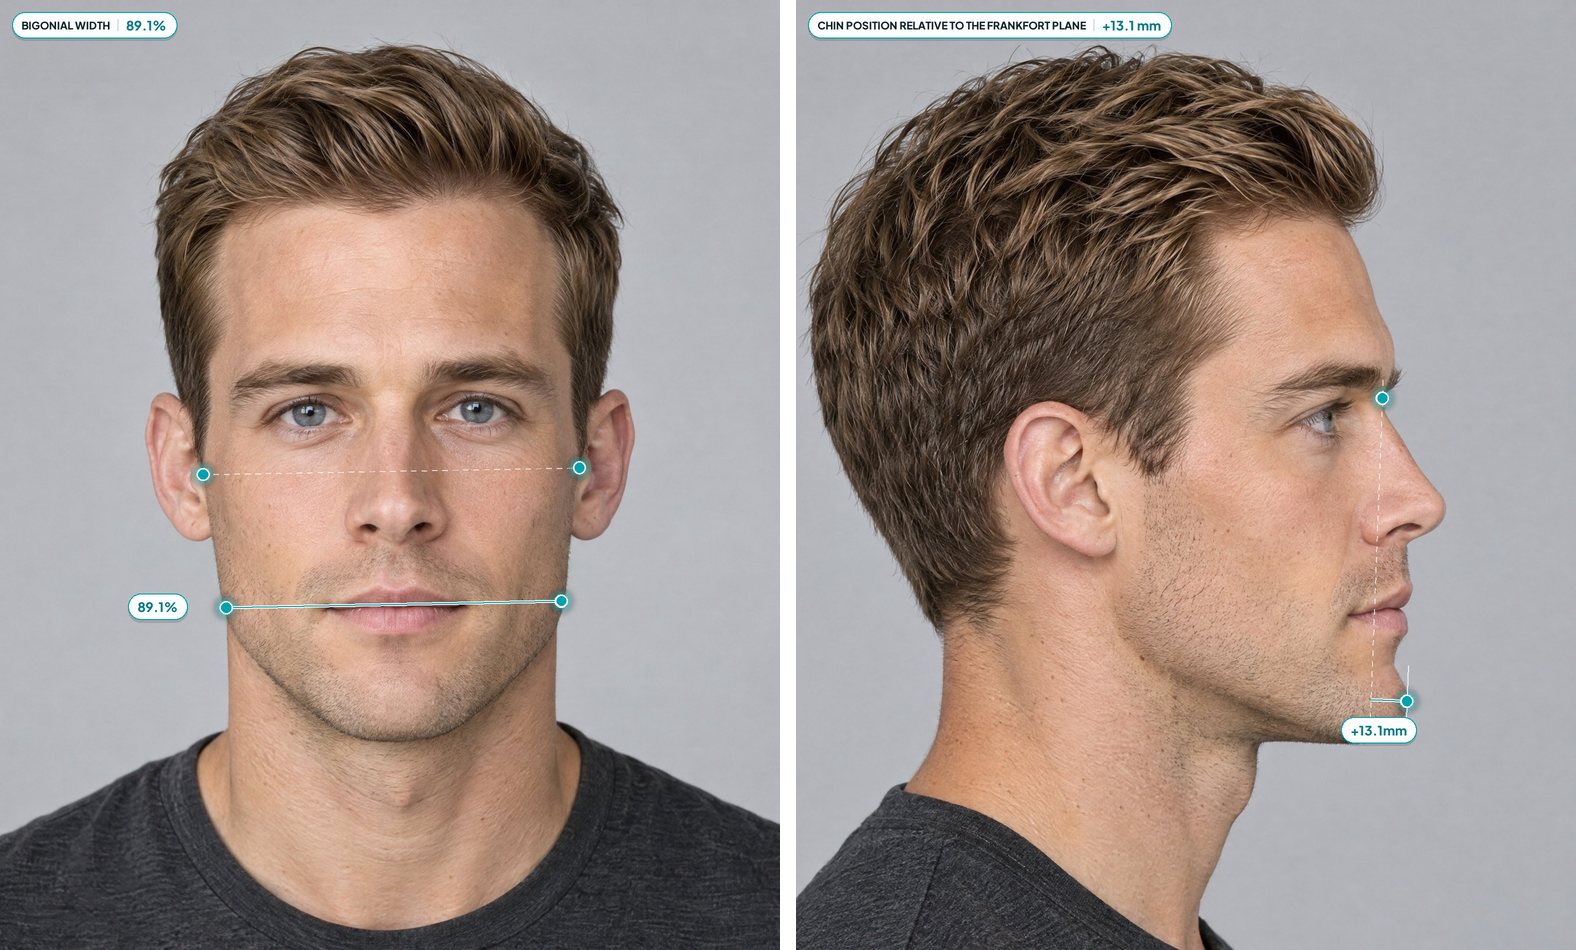
The lines above measure his jaw and chin for Harmony. Angularity and Masculinity rate how they look, together with the brow and other features. His jaw and chin definition are rated 8 out of 10 each, and together they make up half of Angularity. For Masculinity his jaw is also rated 8, and there the jaw and the brow ridge each count ten times as much as hair length.
His under-chin angle measures 122.4 degrees, a Focus area, yet his under-chin definition is rated 8 out of 10. Both are right. The angle checks the shape where chin meets neck against a range, and the rating judges how defined it looks. Two tests that weigh these differently can disagree about the same face.
Women see Femininity in place of Masculinity, with the same 10 traits rated toward feminine. Their Harmony uses the female ranges, a few of which are in the table below.
Features, the pillar with no lines
Features has nothing to draw. It is 31 visual ratings in 8 groups, from skin to nose shape, plus a small deduction for asymmetry. His skin is the best group, at 9.5 on average. Creasing costs him most, spread over several kinds of crease; the lowest is the folds from nose to mouth corners, at 7. Symmetry, the trait the internet obsesses over, scored 9.8 and cost him 0.02 points.
It is also the pillar most tied to things you can change, such as skin, sleep, hair and brows.
How 4 pillars become one score
The final score is a geometric mean (multiply the four, then take the fourth root), so the weakest pillar pulls hardest. Pillars of 9, 9, 9 and 3 give 6.84, not the 7.5 of a plain average. His four pillars are close, so on his face the effect is small. One extra point on Harmony would lift his score to 7.32, and one on any other pillar to about 7.27.
Read the pillars before the final score. Our three example faces land within half a point of each other (6.68 to 7.12), yet the one with the best Harmony, 7.25, has the lowest Angularity and Masculinity of the three. Their final scores look alike. Their pillars don’t.
How to read your attractiveness score
Every measurement on the report is scored by its distance from your own ideal range, and the label tells you how far. Inside the range is Ideal. Outside it, the label drops with the score: Great from 8, Good from 6, Fair from 4, Focus area under 4. Pillars and the final score use the same words, with Exceptional at 9 or more and no Ideal.
What counts as a good score? On this scale Good, 6 or more, is a strong result. All three of our example faces land there, and two of them have a Fair Harmony, so one Fair pillar doesn’t sink the total. If your final score lands in Fair or lower, start with your lowest pillar and the lines the report says hold it back. We don’t turn scores into percentiles or tiers, because a ranking against strangers’ photos, taken any old way, says as much about their cameras as about your face.
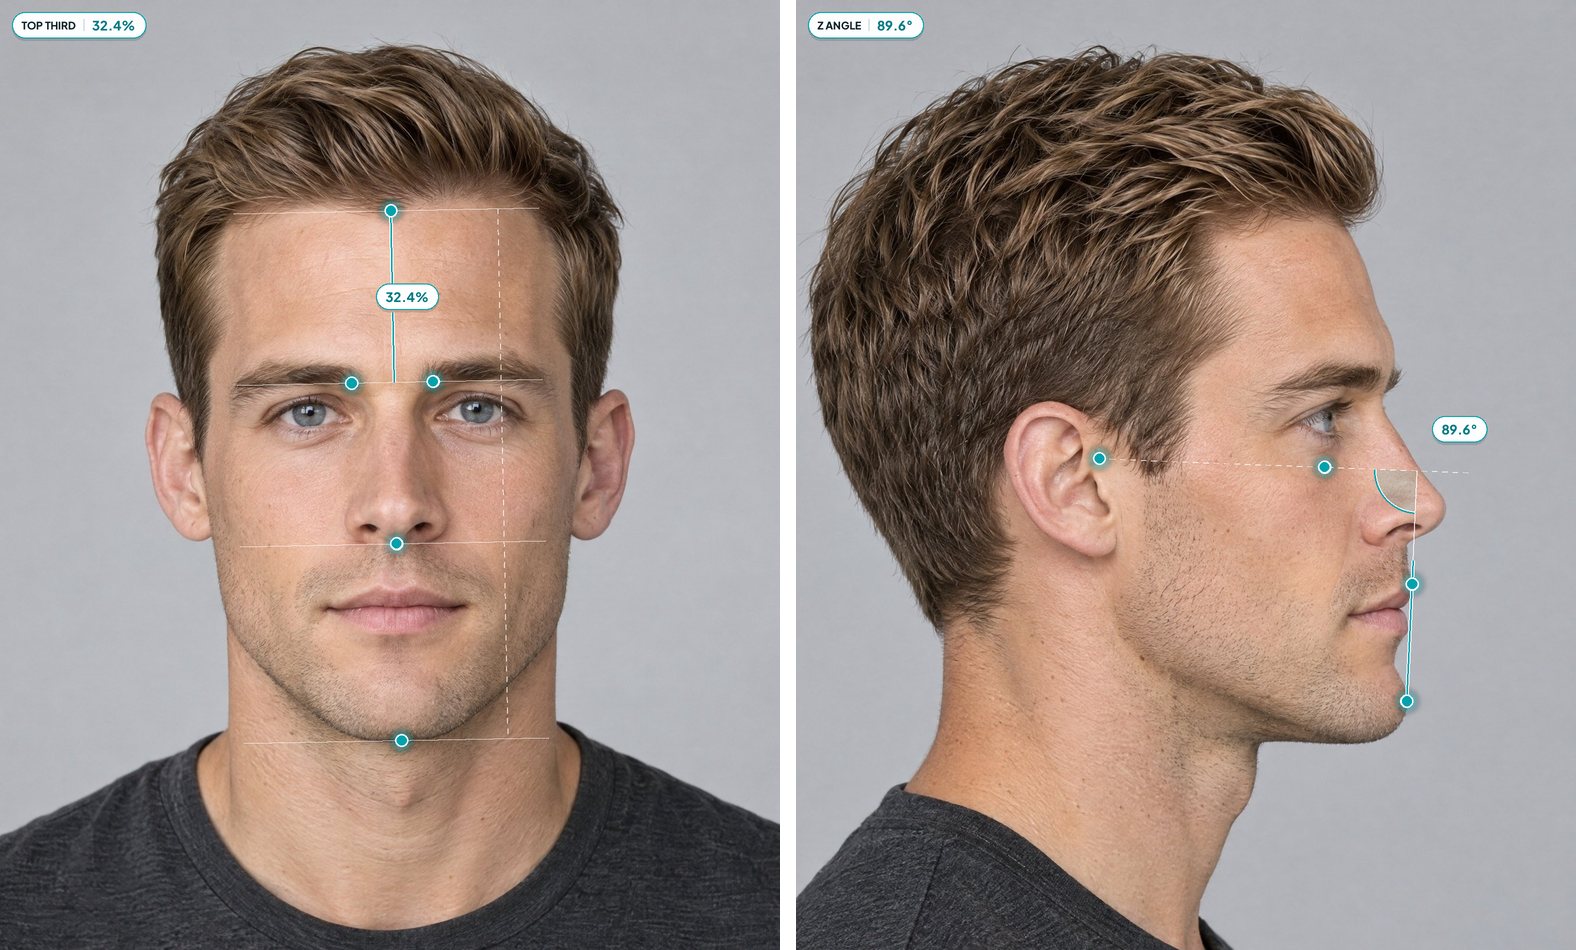
Of the 66 ideal ranges, 50 differ between men and women and 44 shift with the heritage you pick at upload. Here are six. The men’s column is the set the sample face was scored on, and heritage nudges a few, such as jaw width and the top third.
| Measurement | Men | Women |
|---|---|---|
| Eye aspect ratio | 3.0 to 3.5 | 2.8 to 3.3 |
| Neck width, % of jaw width | 92 to 98% | 74 to 80% |
| Jaw width, % of cheekbone width | 87.5 to 91.5% | 84 to 88% |
| Top third of the face | 30 to 32% | 31 to 33% |
| Z angle | 78 to 82° | 76 to 80° |
| Under-chin angle | 94 to 106° | 94 to 106° |
The under-chin angle is one of the 16 ranges the sexes share, and no heritage shifts it, so his angle falls outside it in every set. Your report lists up to six focus areas, the well-measured lines scoring under 6, each with tips you control. Five of his six are labeled Fair, neck width and the Z angle among them. His other line labeled Focus area, cheekbone height, was measured with low confidence, so it stays off the list.
How accurate is an attractiveness test?
An attractiveness test can be accurate in two senses. One is repeatability: we ran the same photos of two people through ours three times each, and the final score varied by 0.05 and 0.09. The other is matching how people see you, and no test can promise much there.
Crowds are surprisingly consistent. A 2000 review in Psychological Bulletin found strong agreement between groups of raters, within and across cultures, and much weaker agreement between two single people.1 In the twin study from the opening, two random people agreed on only 48% of their face preferences, and the authors traced that personal half mostly to each viewer’s own environment, not genes.2 So “beauty is in the eye of the beholder” is half right, and a test can only read the crowd’s half from your photo.
A lean look, an average-looking shape and, for women, a more feminine shape have the best support. In a 2025 study that measured shape from 132 points on 100 faces, shapes closer to the average were rated more attractive, and a more feminine shape helped women, though the authors call the effects quite weak.5 In a 2017 study, femininity was the strongest predictor for women’s faces, and faces that looked leaner were rated more attractive in both sexes.6 Symmetry and masculinity, the two cues people argue about most, are the shakiest. Each helped men’s ratings in one study and made no clear difference in the other.56
Don’t read a score as a health check. In the 2017 study, links between attractive facial traits and measured health were weak, with little evidence at all in women’s faces.6
A still photo also misses a lot:
- Movement and expression. Photo and video ratings of 208 faces correlated at about 0.7, strongly related but not the same. Earlier, smaller studies disagreed.4
- Everything beyond the face, such as voice, body, height, style and personality.
- Real size. A photo has no ruler, so millimeters are estimated from an assumed 190 mm from hairline to chin.
- Bone. Every point sits on skin.
No single number decides how attractive you are, least of all one from a still photo.
Bias is a reasonable worry. Two of these studies used only white faces and the twin study’s raters were Australian, so their findings may not hold for every group.562 Our ideal ranges differ by sex and heritage, and our skin ratings are set up to score conditions such as acne or uneven pigment, not skin tone.
Why the same face gets different scores
Because tests measure different things, and the photo itself changes both how a face is rated3 and the proportions that show on it.7 Most of what comes up for “beauty test” or “face attractiveness test” falls into three kinds.
| Kind | What it does | Where it falls short |
|---|---|---|
| Fixed-formula calculators | Add up a few front-photo ratios with set weights, often symmetry and the golden ratio | One formula for everyone, front photo only, no ranges by sex |
| Models trained on crowd ratings | Copy how groups rated a set of faces and output one number | A black box with no lines to check, and only as fair as the faces it learned from |
| Human votes and quizzes | Strangers rate your photo, or you answer questions about yourself | Single raters agree only moderately,1 so a few self-selected votes can swing the result, and a quiz scores your answers, not your face |
Chat assistants are a newer route. They describe a photo in words and can attach a number, but they place no points and show no ranges you can check.
Then there’s the photo. In one study, 17 people were each rated from 20 everyday photos. Their scores shifted from photo to photo, though attractiveness varied less than trustworthiness or dominance, and the gaps between people held. The face showed through, and the photo still nudged the score.3
Our final score barely moves on the same photos, so when two of your results disagree, suspect the photo first and the test second.
How to take a fair attractiveness test photo
Copy the way research face photos are taken, front-on with a neutral face, mouth closed and even light.56 We also ask for about 1.5 m (5 feet) and the lens at eye level.
- Use the rear camera, which is usually the sharper one. Ask a friend to hold the phone, or prop it up and use the self-timer.
- Stand about 1.5 m away and zoom in rather than stepping closer. If you must hold the phone yourself, full arm’s length is the minimum. In a geometric model of an average face, a camera 30 cm away makes the nose about 30% wider against the cheekbones than a distant one; at 1.5 m the effect shrinks to a fraction of that, which the authors call essentially no difference.7 Photos of 18 men taken from 45 cm were also rated a little less attractive than ones taken at the same moment from 135 cm.8
- Put the lens at eye height, keep your chin level and look into the lens, not the screen. From 40 cm, a phone 10 cm below your eyes flattens canthal tilt by almost 3 degrees in our model, more than the whole men’s ideal range (1.7 degrees wide). From 1.5 m the same slip costs under 1 degree. A phone held below your eyes can make a normal tilt read low.
- Face a window for soft, even light. Turn off filters and beauty mode, which smooth the skin and under-eye detail that Features rates. Makeup is your call, but wear the same amount each time.
- Take your glasses off, because the frames sit on the eye corners and brows. Push your hair off your forehead and away from your ears. Six measurements use the hairline point, all three facial thirds among them. Tie long hair back so it can’t hide the chin, jaw and neck points.
- Keep a neutral face with your lips closed; a smile moves points in a third of the measurements. A beard can stay. Points it covers are estimated, the measurements that use them are marked est, and those never make your focus-area list. If you want those lines measured rather than estimated, test after a short trim.
- For the side photo, turn a full 90 degrees at the same distance and height. Your ear and whole jawline should be in view, because that photo carries half the measurements and is leveled on the line from the ear notch to the eye-socket rim.
- Check that both photos show your whole head, with nothing covering your hairline or jaw. Note where you stood and the time of day, so your next test matches.
What to change after the test, and how to retest
Each retest is a new scan, and the bigger packages include extra ones, so set it up the same way: same spot, distance, camera height, light and expression. Then compare pillar by pillar and count only changes of half a point or more. That threshold comes from our re-scans, where identical photos changed the final score by under 0.1 but side Harmony by up to 0.47. Single measurement scores, mostly for side-photo angles, moved by several points out of 10 between those runs, so judge progress by the pillars, not by one line or by which items make the focus-area list. A changed setup can shift values more; we haven’t tested how much.
What you can change, starting with what Features weighs most:
- Skin and sleep: a gentle cleanser, a moisturizer and daily sunscreen, and a normal night’s sleep before photo day for the under-eyes.
- Hair: a cut that still holds its shape, and for men a beard trimmed to follow the jawline.
- Brows: tidy the strays and keep your natural shape.
- Posture and weight: two of his six focus areas, neck width and the under-chin angle, sit on the neck and under the chin, and in a photo both change with how you hold your head. Stand tall with your chin level, neither tucked nor raised. If you carry extra weight, ordinary diet and exercise are the honest route; in one study, faces that looked leaner were rated more attractive.6
Most of the 66 measurements follow your bone structure and the shape of your nose, eyes and lips, and effort won’t move them much. That’s fine. They feed one pillar out of four. Even if all six of his focus areas sat inside their ranges, his final score would rise by only about a quarter of a point.
The whole report is on the sample face if you want to see every section first. When you’re ready, get your own. You can delete your report and photos anytime, in one click.
Questions people ask
Are attractiveness tests accurate?
At best, a test estimates how a group of strangers would rate a photo, and no photo test can predict one person's taste. Group averages agree strongly, even across cultures, while two random people agree on only about half of their face preferences. Ratings also shift between photos of the same person. Our re-scans of identical photos moved the overall score by under 0.1, which shows our scoring is repeatable, not that it matches any group of raters. A test that draws the lines it measured lets you check them.
Why did a different photo give me a different score?
Because the photo changes what the test can see. In a geometric model, a camera at about 30 cm makes the nose about 30% wider against the cheekbones than a distant one, and close photos were rated a little lower. In our model, a phone below your eyes flattens eye-corner angles. A smile moves points used by 22 of the 66 measurements in a report, and hair or a beard can hide hairline, chin and jaw points. Keep the setup the same each time.
Does an attractiveness test work the same for men and women?
Ours uses the same process with different ranges. Of the 66 ideal ranges, 50 differ by sex: neck width, for example, is 92 to 98% of jaw width for men and 74 to 80% for women. Women see a Femininity pillar instead of Masculinity. Men and women largely agree on which faces look attractive: in one large study their average ratings correlated at 0.99. Some tests use one formula for everyone, so the same face can score differently there.
Can an attractiveness test rate my side profile?
Only if it asks for a side photo, and most online attractiveness tests do not. Of the 66 measurements in a report, 33 come from the profile, including the jaw angle, chin position, nose and lip lines and the angle under the chin. On our sample face, side Harmony is 6.4 against 5.6 from the front, so the two views can disagree. Take the side photo at a full 90 degrees with your ear in view.
What is a good score on an attractiveness test?
On ours, 6 or more is Good, 8 or more Great and 9 or more Exceptional, for the overall score and for each pillar. The top of the scale is hard to reach by design: a face scoring 8 on every one of its 66 measurements would get a Harmony of only about 6.3. A Good result can include a Fair pillar (4 to 6): our sample face is Good overall with a Fair Harmony. Other tests use other scales, so their numbers do not carry over to ours.
How often should I retake an attractiveness test?
When something a photo can show has changed, such as a new haircut, a beard, a skin routine or your body fat, rather than on a schedule. Each retake is a new scan, so use the same photo setup every time. Re-scans of the same photos moved our overall by under 0.1 and the side-photo part of Harmony by up to 0.47, so track your progress pillar by pillar and count only changes of half a point or more.
What happens to my photos after the test?
On ours, your photos are stored privately with your report, so when you come back every line is still drawn on your own face. Only you can open your report, and your photos are never used to train any AI model. You can delete your report and photos anytime, in one click.
Sources
-
Langlois JH, Kalakanis L, Rubenstein AJ, Larson A, Hallam M, Smoot M. Maxims or myths of beauty? A meta-analytic and theoretical review. Psychol Bull. 2000;126(3):390-423. doi:10.1037/0033-2909.126.3.390. Abstract on PubMed ↩↩
-
Germine L, Russell R, Bronstad PM, et al. Individual aesthetic preferences for faces are shaped mostly by environments, not genes. Curr Biol. 2015;25(20):2684-2689. doi:10.1016/j.cub.2015.08.048. Full text on PMC ↩↩↩
-
Gogan T, Beaudry J, Oldmeadow J. Within-person variability in first impressions from faces. Perception. 2021;50(7):595-614. doi:10.1177/03010066211019727. Abstract on PubMed ↩↩
-
Kościński K. Perception of facial attractiveness from static and dynamic stimuli. Perception. 2013;42(2):163-175. doi:10.1068/p7378. Abstract on PubMed ↩↩
-
Lee P, Li J, Rafiee Y, Jones BC, Shiramizu VKM. Further evidence that averageness and femininity, rather than symmetry and masculinity, predict facial attractiveness judgments. Sci Rep. 2025;15(1):5498. doi:10.1038/s41598-025-86974-0. Full text on PMC ↩↩↩↩↩
-
Foo YZ, Simmons LW, Rhodes G. Predictors of facial attractiveness and health in humans. Sci Rep. 2017;7:39731. doi:10.1038/srep39731. Full text on PMC ↩↩↩↩↩↩↩
-
Ward B, Ward M, Fried O, Paskhover B. Nasal distortion in short-distance photographs: the selfie effect. JAMA Facial Plast Surg. 2018;20(4):333-335. doi:10.1001/jamafacial.2018.0009. Full text on PMC ↩↩
-
Bryan R, Perona P, Adolphs R. Perspective distortion from interpersonal distance is an implicit visual cue for social judgments of faces. PLoS One. 2012;7(9):e45301. doi:10.1371/journal.pone.0045301. Full text on PMC ↩
Spotted a mistake? Email support@faceratinglab.com and we will fix it.