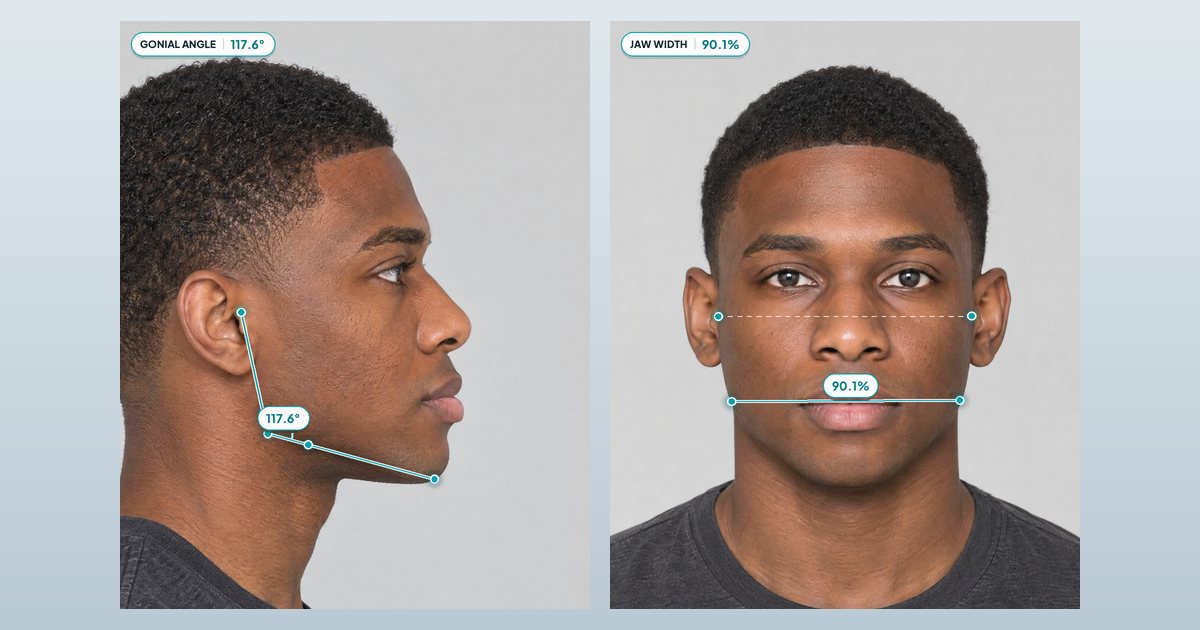
Facial harmony: what it is and how a harmony score is built
Facial harmony is how well your features fit each other and the whole face, front and side. No golden number decides it: our Harmony score combines 65+ measurements from a front and a side photo.
The short version
- Each of the 65+ measurements is scored against its own ideal range, and within a photo they all count the same, the facial thirds included.
- A face scoring 8 out of 10 on all 66 of its measurements would get a Harmony of only about 6.3, so a Good Harmony, 6 or more, is a solid result.
- Your profile counts for about 40% of Harmony, and the two photos can disagree: one of our example faces scores 5.88 from the front and 4.54 from the side. A harmony test that uses only a front photo cannot see that.
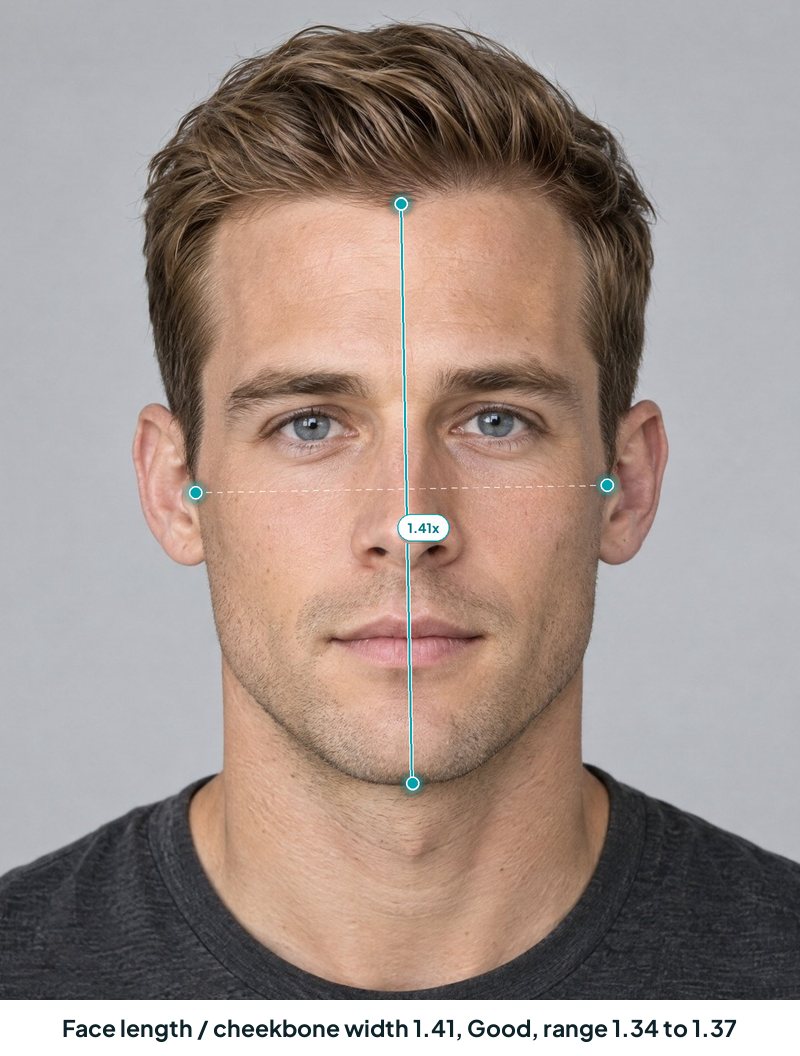
- Harmony is neither symmetry nor the golden ratio. The same face scores 9.77 for symmetry and 5.92 for Harmony, and our ideal face length to cheekbone width is 1.34 to 1.37 for men and 1.32 to 1.35 for women, far from 1.618.
- Most of the 66 are set by bone and soft-tissue shape. The clearest ones you can influence are your brows and, through posture and body fat, the angle under your chin, plus the photo itself; hair, beard, makeup and glasses change how the proportions look.
Facial harmony comes down to comparisons: your eye spacing against the width of your face, your mouth against your nose. Our Harmony score is strict by design. The face in our sample report has 39 of 66 measurements rated Great or Ideal, and his Harmony is still 5.92 out of 10, Fair.
“Good features, bad facial harmony” gets said a lot on face-rating sites, with one feature picked out as the culprit. In our measurements, a low Harmony usually comes down to many small differences spread across the face.
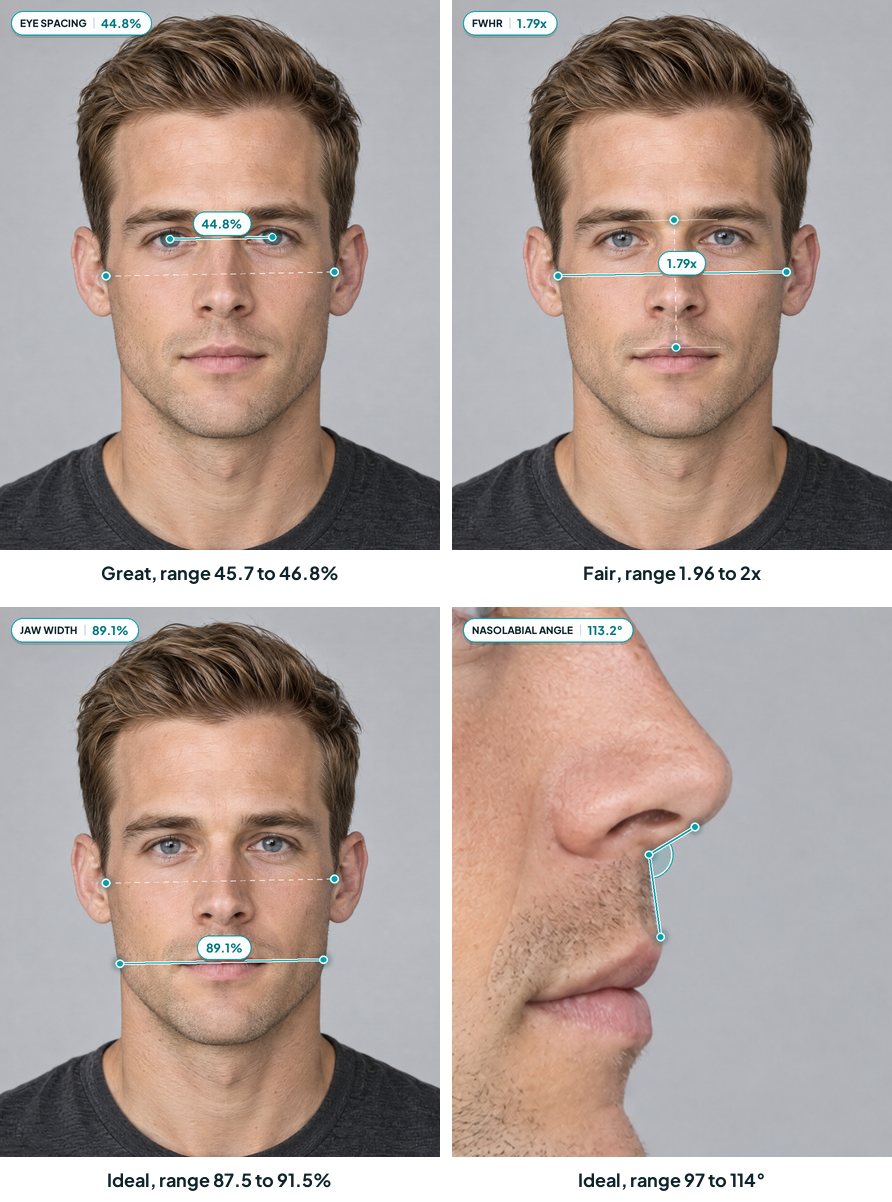
Harmony is the lowest of his 4 pillar scores, more than a point below each of the other three. His overall score, which combines all four, is still 7.04, Good.
If someone told you your features don’t fit together, start with why good features can still mean a Fair Harmony. The home check needs two phone photos and a printout or a photo editor.
What is facial harmony?
Facial harmony is how your features look together rather than one by one: whether their sizes, spacing and angles fit each other and the whole face, from the front and in profile.12 It is read through proportions such as the facial thirds, eye spacing, jaw width against the cheekbones and the angle between nose and lip, and our Harmony score checks 66 of them against ideal ranges.
A nose can look longer or shorter next to the lips and chin around it. People read a face all at once. One composite-face experiment, summarized in a 2018 paper, found that the bottom half of a face changed how attractive the top half looked, even when raters were told to judge only the top. The same eye can look bigger or smaller depending on how far it sits from the brow.2
One research team calls this whole-face fit “facial harmony or gestalt”, and clinics tend to say facial balance. There is no one harmonious face to copy: normal faces fit together in many different ways.1
Most of what our engine measures is a comparison of this kind. On the sample report, 53 of the 66 measurements are ratios or angles, which come out the same whether a face is large or small. The other 13 are offsets in millimeters, most of them about where the lips and mouth sit.
People agree on who looks attractive far more than “beauty is in the eye of the beholder” suggests, within cultures and across them.3 That shared sense is what proportion research, and our Harmony score, try to pin down.
How a facial harmony score is calculated
A facial harmony score measures ratios and angles between points on your face, scores each one against an ideal range and combines the results into one number. Ours uses 65+ measurements from a front and a side photo.
Research has no single agreed harmony scale. A 2013 team writing in an oral and maxillofacial journal said their field “would greatly benefit from an objective assessment of facial harmony” and proposed their own method, built to tell normal from abnormal face shapes rather than to rate looks.1 So every facial harmony calculator, ours included, rests on choices its makers made: which ratios to measure and how to add them up.
- The engine places a mesh of 478 face points on the front photo and levels it on the pupils (how it places them). On the side photo it places profile points and levels them on the Frankfort plane orthodontists use, a line from the ear to the lower rim of the eye socket. The engine puts that rim about 13 mm below the lower eyelid.
- It measures distances and angles between those points, and turns most distances into ratios.
- Each measurement gets a score out of 10 against its ideal range: 10 anywhere inside the range, falling smoothly the further outside it you go.
- The 33 front scores combine into front Harmony, and the 33 side scores into side Harmony.
- Harmony is about 60% front and about 40% side.
The fall in step 3 is gentle near the edge. A measurement only drops to 5 out of 10 when it sits well outside its range: 2.8 percentage points for the lower third and 8.4 degrees for the jaw (gonial) angle. On the sample face, face width to height misses its range by 0.17, a wide miss for this ratio, and scores 4.8, Fair.
There is no hidden favorite. Each third counts exactly as much as the position of your mouth corners.
| Front photo (33) | Side photo (33) |
|---|---|
| Facial thirds: 3 | Forehead and brow ridge: 3 (incl. nasofrontal angle) |
| Face shape: 5 (incl. midface ratio) | Facial profile: 8 (incl. convexity) |
| Eyes and brows: 7 (incl. eye spacing, canthal tilt) | Nose: 8 (incl. nasolabial angle) |
| Nose: 5 | Lips: 8 (incl. the E-line) |
| Mouth: 6 (incl. mouth to nose width) | Jaw: 5 (incl. gonial angle) |
| Jaw: 4 (incl. jaw width) | Neck: 1 (angle under the chin) |
| Ears and neck: 3 |
Inside its range, a measurement is rated Ideal. Outside it, the words are Great from 8, Good from 6, Fair from 4 and Focus area under 4. Pillar scores use the same words, with Exceptional at 9 or more and no Ideal.
Harmony is the only one of the 4 pillar scores built directly from measurements. Angularity, Masculinity or Femininity, and Features come from 46 visual ratings (Features also takes in a light symmetry check).
Good vs low facial harmony
Good facial harmony means most of your proportions sit inside or close to their ideal ranges, front and side. Low harmony rarely comes from one feature. It comes from many small misses spread across the face. On our scale, a Harmony of 6 or more is Good and under 4 is a Focus area. Our top example face scores 7.25 and sits inside his ideal range on 29 of 66 measurements. The other two score 5.92 and 5.36, with 20 each.
What lifts the top face is that both photos hold up: 7.39 from the front and 7.02 from the side. The lowest, face 2 in the table further down, scores 5.88 from the front but 4.54 from the side.
Can you have good features and low facial harmony?
Yes. On our scale it is a normal result, and the sample face shows how it happens.
Of his 66 measurements, 20 sit inside their ideal range and 19 more are Great. Another 11 are Good, 14 are Fair and just 2 are Focus areas. Average all 66 scores and you get 8.0. His Harmony comes from a front score of 5.63 and a side score of 6.38.
So how does an average of 8.0 become 5.92? Harmony isn’t an average. It starts at 10 and subtracts for every measurement that falls short, and it subtracts more than the shortfall itself: score all 66 of his measurements at exactly 8, two points short each, and his Harmony comes out at about 6.3, nearly four points down. At 9 on every one it would be about 8.1. We built it so that a high Harmony needs most measurements at or very near 10.
No one feature is to blame, either. Take a face with 65 perfect measurements and one at 0. Its Harmony would still come out at about 9.5, or 9.7 if the zero is on the side photo.
On the sample face, no single out-of-range measurement costs him more than 0.28 points of Harmony. A Fair one costs about 0.1 to 0.2, and one rated Great less than 0.05. His canthal tilt is +2.7 degrees, Fair, and it costs him about 0.16 points. One measurement weighs that little.
One trait can also show up in more than one measurement. His face width to height is low (1.79, where our range starts at 1.96), and his face length to cheekbone width is high (1.41, where it ends at 1.37). Both point the same way: the face is a little long for its cheekbone width.
If your own report shows a Fair Harmony next to a page of Great results, this is usually why.
Why no single ratio decides your harmony score
The facial thirds are one of the most quoted harmony rules. Here is how far they get you on three faces our engine measured.
| Face | Harmony | Front | Side | Facial thirds | Midface ratio |
|---|---|---|---|---|---|
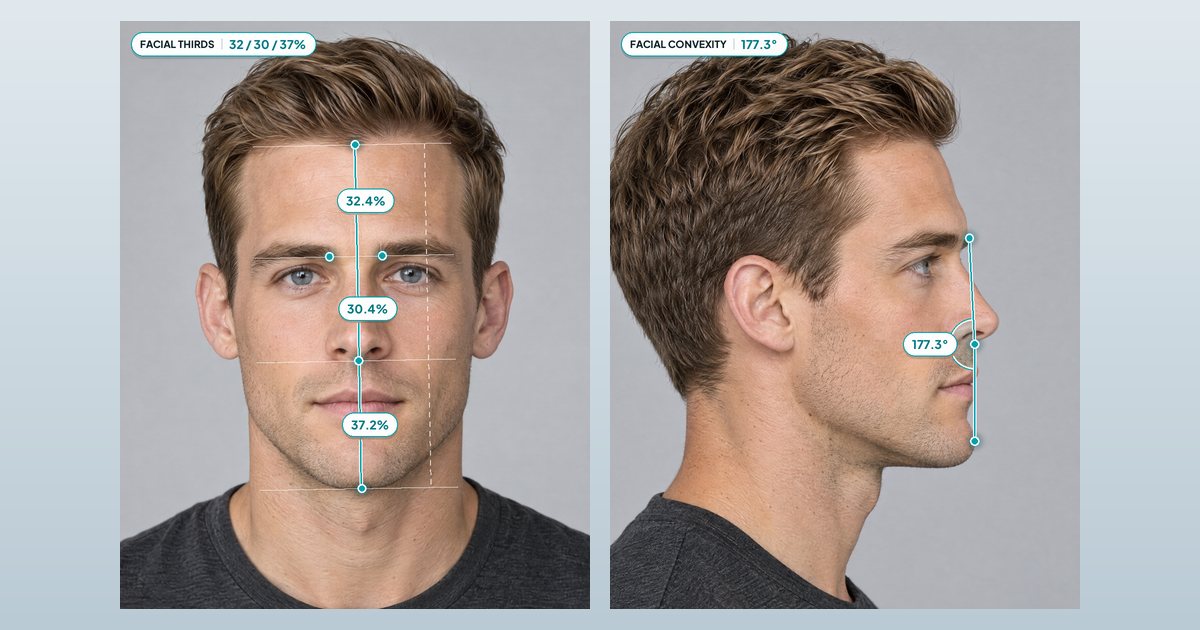
| 1 (sample report) | 5.92 | 5.63 | 6.38 | 32.4 / 30.4 / 37.2% | 0.94, Great |
| 2 | 5.36 | 5.88 | 4.54 | 30.8 / 32.0 / 37.2% | 1.12, Fair |
| 3 (East Asian ranges) | 7.25 | 7.39 | 7.02 | 30.8 / 33.9 / 35.3% | 0.93, Great |
All three have thirds inside or close to their ideal ranges, scoring 9.65, 9.99 and 10.0, and their Harmony still runs from 5.36 to 7.25. Face 2’s thirds are close to perfect, yet they are only 3 of his 66 measurements.
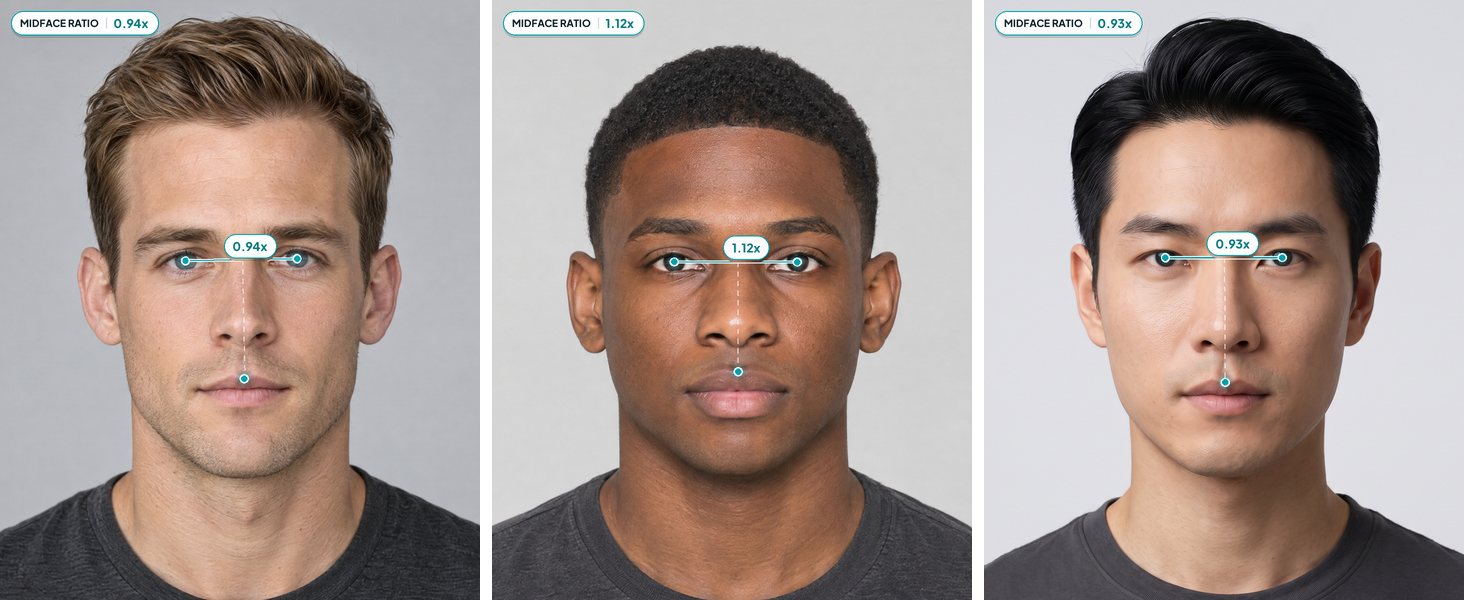
The profile can also overrule the front. Face 2 gets 5.88 from the front and 4.54 from the side, and face 1 is the other way round. Any harmony test that works from one front photo is blind to the profile, about 40% of our Harmony score.
Facial harmony ratios for men and women
Ideal ranges change with sex and heritage: 50 of our 66 are set separately for men and women, and 44 shift with heritage for at least one sex. Your report uses the set for the sex and heritage you pick at upload. The table shows the set for White / European and Black / African heritage. East Asian and South Asian heritage have their own, and the two other options, “Mixed, Latino, Middle Eastern or other” and “Prefer not to say”, use a broad mixed set.
For men, equal thirds are not our target. Our ranges make the lower third the longest of the three, and a face split into exactly equal thirds, 33.3% each, would miss two of the three. The women’s ranges sit close to equal: a face inside all three comes out at about 33 / 34 / 33%, with the middle third a little the longest.
Research backs ranges over rules. In 153 young adults, even the best-fitting of nine classical art rules matched only 40% of people, and the rules about equal heights, equal thirds among them, fitted worst.5
| Measurement | Men | Women |
|---|---|---|
| Top third (share of face height) | 30 to 32% | 31 to 33% |
| Middle third | 31.4 to 33.4% | 32.4 to 34.4% |
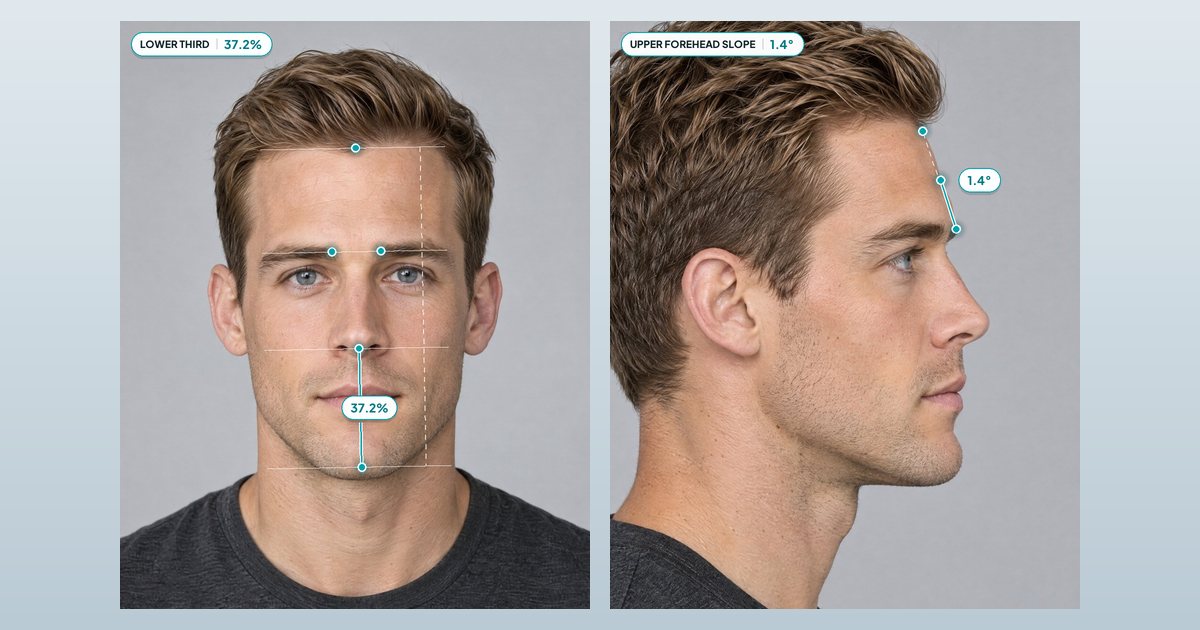
| Lower third | 33.9 to 37% | 30 to 33.1% |
| Face length to cheekbone width | 1.34 to 1.37 | 1.32 to 1.35 |
| Eye spacing (pupils over cheekbone width) | 45.7 to 46.8% | 46.4 to 47.5% |
| Midface ratio | 0.97 to 1.0 | 1.04 to 1.07 |
| Canthal tilt | +6 to +7.7° | +6.8 to +8.5° |
| Jaw (gonial) angle | 115 to 121° | 118 to 124° |
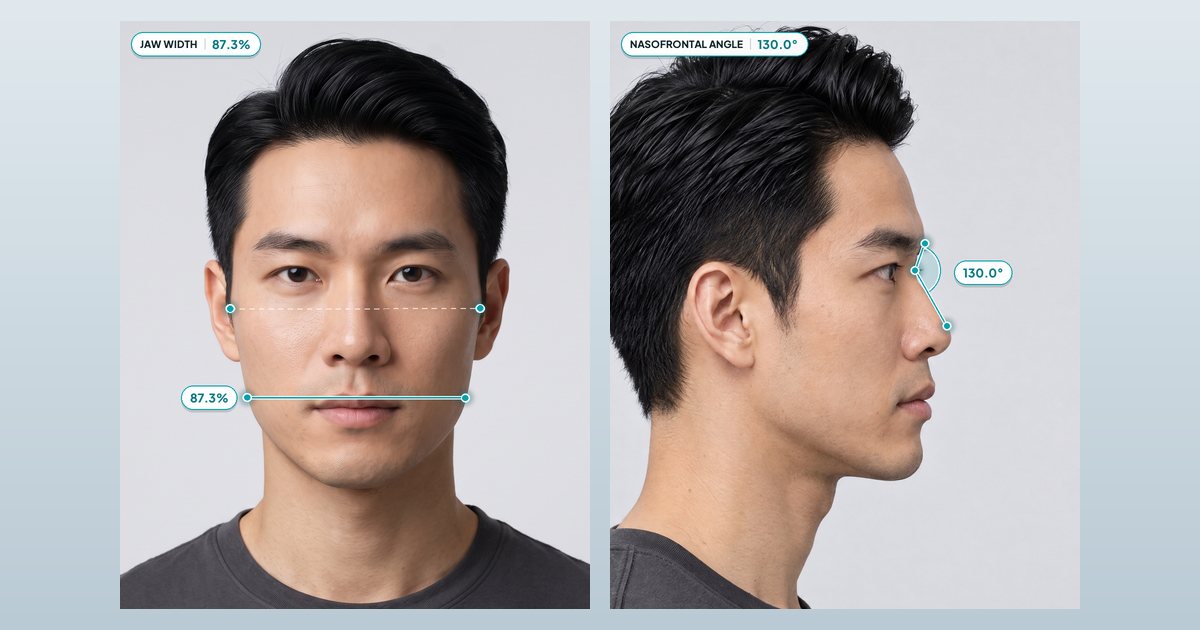
| Nasofrontal angle (between forehead and nose) | 116 to 128° | 139 to 151° |
Some ranges move with heritage: canthal tilt is set higher for East Asian heritage (men +7.7 to +9.4 degrees, women +8.5 to +10.2), and face 3 was scored against that set. Heritage only picks the yardstick, and no set ranks above another.
Culture shifts some profile preferences. When lay judges from four backgrounds rated soft-tissue profiles, the lip position they preferred ranged from about 2.1 to 3.5 mm behind the E-line, and the background and sex of the face being judged changed the choice too.6
One caveat covers this whole page. Much of this research used small groups of mostly white and often only female faces, so the evidence on men, and on faces of other heritages, is thinner. Treat every range here as a guide, ours included.7258
How to test your facial harmony at home
Want to know if you have good facial harmony? You can check six of the main measurements with two phone photos in about 10 minutes. You need a photo editor that shows pixel positions, or a printout and a ruler. It is a rough facial harmony test, and only as good as your photos. The ranges in the steps are the White / European and Black / African set from the table, with a note where other heritages differ most.
- Ask a friend to take two photos with the rear camera, or prop the phone up and use the timer: one straight on and one in full side profile, from about 1.5 m (5 feet) away with the lens at eye level. The distance keeps lens distortion low. Keep your chin level and your hair off your forehead so the hairline shows, with a relaxed face and no glasses.
- On the front photo, note the height of four points: your hairline, the level of your brows, the bottom of your nose where it meets the lip, and the bottom of your chin. On a printout, millimeters on the paper work as well as pixels, since only the proportions matter.
- Divide each of the three gaps by the hairline-to-chin total and multiply by 100. Those are your thirds; compare them with the table above. The sample face comes out at 32.4 / 30.4 / 37.2.
- Check “one eye apart”, part of the rule of fifths: compare the gap between your inner eye corners with the width of one eye. Our ideal gap is 0.95 to 1 eye width for men and 0.98 to 1.03 for women, higher for East Asian heritage. His is 0.95, Ideal. Our engine measures the eye out to the edge of the upper-lid fold, so a corner-to-corner check is close, not exact.
- Compare your mouth width, corner to corner, with your nose width at the nostrils. Our ideal is 1.42 to 1.5 times for men and 1.52 to 1.6 for women; his is 1.35, Good.
- On the side photo, lay a straight edge from your nose tip to the front of your chin. That is the E-line. Look for your lower lip close behind it, not far back. Our ideal is 1.1 to 4.4 mm behind it for men and 0.4 to 3.7 mm for women, and about 1 mm closer to the line for East Asian, South Asian and mixed heritage. Our engine estimates millimeters from the size of your face. A phone photo has no scale, so judge this one by eye. His lower lip sits about 5.2 mm behind the line, a little farther back than the men’s range and still Great. Preferences vary between cultures, so hold this one loosely.
- Read the six together, not one at a time. The sample face is inside its range on only one of them, the one-eye check. His thirds and his E-line are Great, each costing him less than 0.05 points of Harmony, and his mouth to nose is Good. Small misses like these are not a warning sign. A third about 1 percentage point outside its range, like his middle third, still scores Great. If several of yours miss, what you can change is further down.
A home check covers 6 of the 66 measurements and none of the precise profile angles. When we scanned the same photos of two test people three times each, front Harmony moved by 0.02 at most and side Harmony by up to about 0.5, mostly from the brow-ridge, forehead and nose angles.
Facial harmony vs symmetry and the golden ratio
Harmony vs symmetry
Symmetry asks whether your left and right halves match. Harmony asks whether your parts fit each other.
In our report, symmetry is a separate check. The engine lines the 3D face mesh up with its own mirror image and compares the two in 10 zones, from the eyes and brows down to the jaw and ears. Symmetry plays no part in Harmony at all. Inside the Features pillar it barely registers: on the sample face it lowers Features by about 0.02 points.
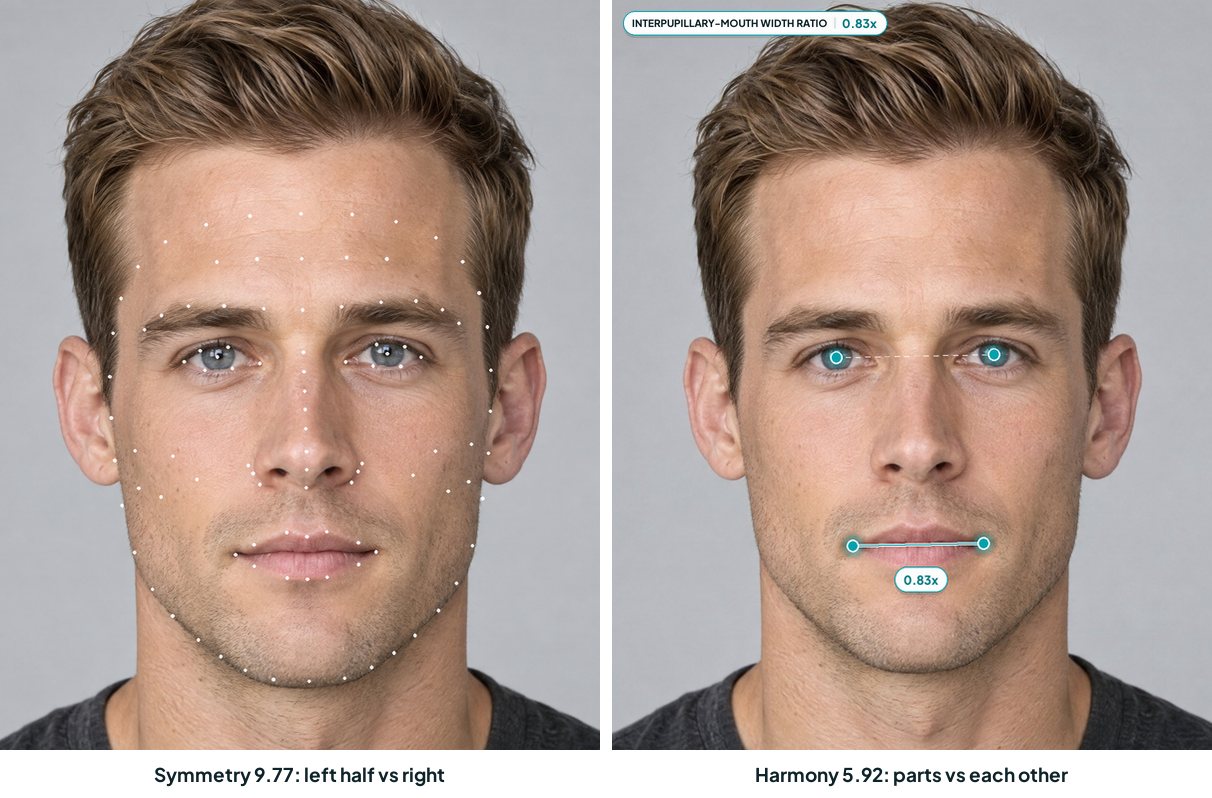
Make a face more symmetric with photo software and people usually prefer the edited version.3 Natural asymmetry, the kind real faces have, seems to matter less. One meta-analysis of studies that measured it in faces and bodies found that correcting for publication bias cut the effect by 30 to 50%, and the few studies with more than 100 people found almost none.9 On the sample face, the 10 zones run from 9.24 for the ears to 9.96 for the nose: small differences, and normal ones.
Is harmony the golden ratio?
No. Every one of our measurements is scored against a range, never a single target number. Take the ratio golden-ratio pages say should be 1.618, face length over face width. Our ideal for it, measured to cheekbone width, is 1.34 to 1.37 for men and 1.32 to 1.35 for women, and the sample face measures 1.41. At 1.618 his face would have to be about 15% longer for the same cheekbones.
The golden ratio usually does poorly in research on real faces too. Of 19 golden proportions tested on photos of 64 adolescents, only 4 related to how attractive the faces were rated, and together they explained 16% of the differences.4
In 3D scans of young adults rated very attractive or much less attractive, facial ratios were not related to attractiveness, with one weak exception, and 7 of 10 ratios differed from 1.618.8 The well-known “phi mask” best fits white female fashion models with masculinized features, and suits non-European faces poorly.10
When researchers changed only the spacing of features on the same faces, the best-liked spacing matched an average face: eyes to mouth at 36 to 37% of face length, pupils about 46% of face width apart. The 46% was far from the classic golden-section value of 38%. The 36 to 37% was close to it, though still statistically different. That study used women’s faces only.7
Our eye spacing ideal for women, 46.4 to 47.5% (45.7 to 46.8% for men), sits close to that study’s 46%. We divide by cheekbone width and the study divided by the width between the ears, so the two numbers are only roughly comparable.
Can you improve facial harmony?
Partly. Most of the 66 measurements are set by bone and soft-tissue shape. A handful respond to things you control, and your photo setup can move many of them.
Start with the photo, using the setup from step 1 of the home check. Tilting your head up or down changes the thirds on the front photo and the angle under your chin in profile, and a head turned slightly away from true profile shifts most side measurements. A beard over the jaw makes the engine estimate the hidden points, and the report marks those “est”. Hair over the hairline is not flagged the same way: the engine still has to place your hairline, and a guess there shifts all three thirds, so pull it back.
Brows are the clearest lever on the front. Brow tilt, brow length and brow height are 3 of the 33 front measurements, and grooming, shaping or brow makeup can change them. Our brow tilt runs from the inner brow to the arch, so a shape that sets the arch a little higher raises it. The sample face’s brow tilt is already Ideal at +6.5 degrees, right on the edge of the men’s range of 6.5 to 11 (women’s is 10.5 to 15).
Under the chin is the lever on the side. His lowest side score is the angle under the chin, 122.4 degrees, a Focus area: about 16 degrees more open than our range of 94 to 106. In profile that shows as a soft line from chin to neck, without a clear corner. How you hold your head for the photo changes it. Over time, posture can change it too, and so can body fat, through ordinary diet and exercise. How much varies from person to person.
Hair, beard, contour makeup and glasses change how your proportions look more than they change the measured points. If your face reads long for its width, as his does, skip extra height on top, keep some fullness at the sides and pick glasses with deeper frames. A beard can make the lower third look squarer or longer, depending on its shape. For women, contour and brow shape change how wide the face looks.
Don’t count on facial exercises or mewing. The measurements sit on bone and soft-tissue points, and we know of no good study showing either one moving them in adults. That is our view, and good evidence would change it.
Keep the score itself in proportion as well. Harmony is one of 4 pillar scores, and it is the one built mostly from things you can’t change. No single number, this one included, decides how attractive you are. The sample report has all 66 measurements on one face if you want to see how the pieces add up. When you want yours, see them drawn on your own photos.
Questions people ask
Is facial harmony the same as symmetry?
No. Symmetry compares your left and right halves. Facial harmony compares your features with each other and with the whole face, front and side. In our report they are separate scores: the face in our sample report scores 9.77 for symmetry and 5.92 for Harmony. Symmetry helps a little. People usually prefer faces edited to be more symmetric, but in real, unedited faces the link looks weaker: one meta-analysis found almost none in the few studies with more than 100 people.
What is a good facial harmony score?
On our 10-point scale, 9 or more is Exceptional, 8 or more Great, 6 or more Good, 4 or more Fair and under 4 a Focus area. Harmony is strict: a face scoring 8 (Great) on every one of its 66 measurements would get a Harmony of only about 6.3, so a Good Harmony is a solid result. Our three example faces score 5.36, 5.92 and 7.25.
Is facial harmony based on the golden ratio?
No. In one study, only 4 of 19 golden proportions related to how attractive faces were rated, and together they explained 16% of the differences. In 3D face scans, most facial ratios were not 1.618, and in another study the best-liked feature spacing matched an average face. Our engine scores ranges instead: face length to cheekbone width is ideal at 1.34 to 1.37 for men and 1.32 to 1.35 for women.
How do I know if I have good facial harmony?
Take a level front photo and a side photo and look at your facial thirds, whether your eyes sit about one eye width apart, your mouth width against your nose width, and your lips against a line from nose tip to chin. Expect a mix: the face in our sample report is in range on only one of these, the one-eye check, and Great or Good on the rest. A full facial harmony analysis takes 65+ measurements from both photos and draws the lines so you can check them.
Do men and women have different facial harmony?
The idea is the same; the ideal ranges are not. 50 of our 66 ranges are set separately for men and women. Our lower-third range makes it the longest part of the face for men, 33.9 to 37% of its height; for women our three ranges sit close to equal thirds. Our jaw angle ideal is 115 to 121 degrees for men and 118 to 124 for women.
How can you improve facial harmony?
Mostly through your photo and grooming rather than your structure. Most of the 66 measurements are set by bone and soft-tissue shape. What can move: your photo setup (camera at eye level, chin level), brow shape (3 of the 33 front measurements), the angle under your chin through posture and body fat from ordinary diet and exercise, and hair, beard, makeup and glasses, which change how your proportions look. We would not count on facial exercises or mewing.
Sources
-
Claes P, Walters M, Gillett D, Vandermeulen D, Clement JG, Suetens P. The normal-equivalent: a patient-specific assessment of facial harmony. Int J Oral Maxillofac Surg. 2013;42(9):1150-1158. doi:10.1016/j.ijom.2013.03.011. Abstract on PubMed ↩↩↩
-
Liu CH, Chen W. The boundary of holistic processing in the appraisal of facial attractiveness. R Soc Open Sci. 2018;5(6):171616. doi:10.1098/rsos.171616. Describes the composite-face work of Abbas and Duchaine (2008) and, for the eye and brow effect, Morikawa et al. (2015). Full text on PMC ↩↩↩
-
Little AC, Jones BC, DeBruine LM. Facial attractiveness: evolutionary based research. Philos Trans R Soc Lond B Biol Sci. 2011;366(1571):1638-1659. doi:10.1098/rstb.2010.0404. Full text on PMC ↩↩
-
Kiekens RM, Kuijpers-Jagtman AM, van ‘t Hof MA, van ‘t Hof BE, Maltha JC. Putative golden proportions as predictors of facial esthetics in adolescents. Am J Orthod Dentofacial Orthop. 2008;134(4):480-483. doi:10.1016/j.ajodo.2006.10.041. Abstract on PubMed ↩
-
Farkas LG, Hreczko TA, Kolar JC, Munro IR. Vertical and horizontal proportions of the face in young adult North American Caucasians: revision of neoclassical canons. Plast Reconstr Surg. 1985;75(3):328-338. doi:10.1097/00006534-198503000-00005. Abstract on PubMed ↩↩
-
Nomura M, Motegi E, Hatch JP, et al. Esthetic preferences of European American, Hispanic American, Japanese, and African judges for soft-tissue profiles. Am J Orthod Dentofacial Orthop. 2009;135(4 Suppl):S87-S95. doi:10.1016/j.ajodo.2008.02.019. Abstract on PubMed ↩
-
Pallett PM, Link S, Lee K. New “golden” ratios for facial beauty. Vision Res. 2010;50(2):149-154. doi:10.1016/j.visres.2009.11.003. Full text on PMC ↩↩
-
Rossetti A, De Menezes M, Rosati R, Ferrario VF, Sforza C. The role of the golden proportion in the evaluation of facial esthetics. Angle Orthod. 2013;83(5):801-808. doi:10.2319/111812-883.1. Full text on PMC ↩↩
-
Van Dongen S. Associations between asymmetry and human attractiveness: possible direct effects of asymmetry and signatures of publication bias. Ann Hum Biol. 2011;38(3):317-323. doi:10.3109/03014460.2010.544676. Abstract on PubMed ↩
-
Holland E. Marquardt’s Phi mask: pitfalls of relying on fashion models and the golden ratio to describe a beautiful face. Aesthetic Plast Surg. 2008;32(2):200-208. doi:10.1007/s00266-007-9080-z. Abstract on PubMed ↩
Spotted a mistake? Email support@faceratinglab.com and we will fix it. First published .